August 2026 Product Update
By GeoRankers Team · Updated on August 5, 2026
Last month's biggest addition was Trends, giving you a run-over-run view of how your visibility, models, competitors, sentiment, and citations change over time. We also added Perplexity as a tracked model, consolidated Google AI Mode and AI Overview into a single Google AI Search platform, and added on-demand runs so you can trigger a fresh analysis whenever you need one.
Trends Section Launch
Trends is your run-over-run view of GeoRankers — instead of looking at a single analysis in isolation, it shows how your visibility score, model performance, competitors, sentiment, negative framing, signals, and citations have changed across your recent runs. You can view this over a 15/30/45/60-day window (Free and Launch plans see up to 30 days).
Trend KPI Summary
What it is: A top-line snapshot of your visibility trajectory for the selected window.
How it works: Shows Period Start Visibility, Latest Visibility (with the change vs. the prior run), Best Visibility, and Current Sentiment, so you get the headline movement before scrolling into the detailed cards.

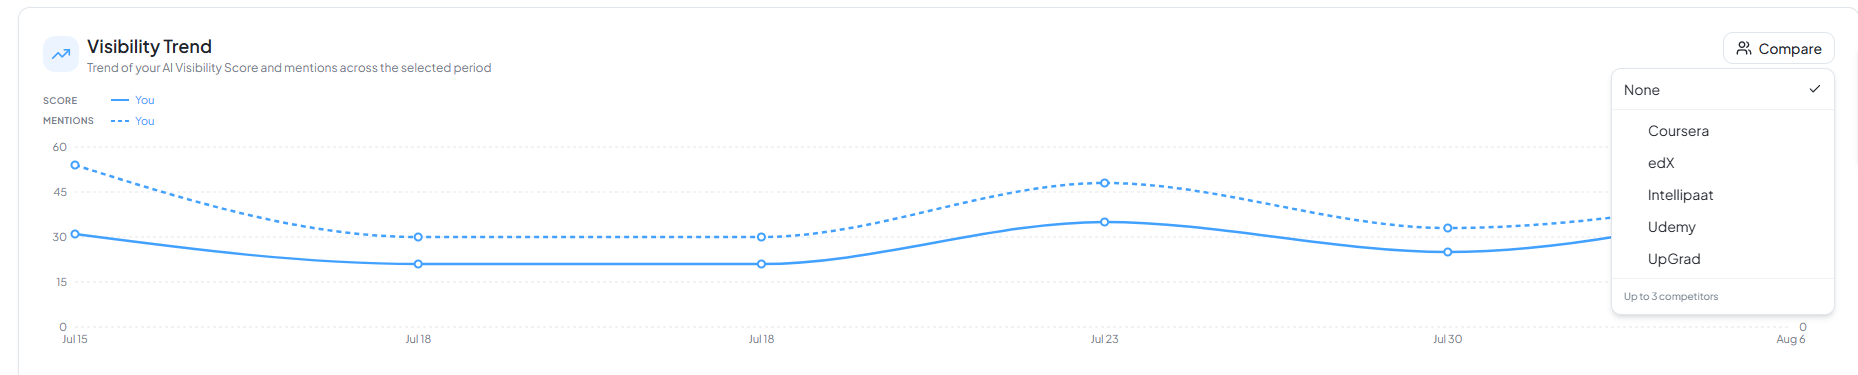
Visibility Trend Chart
What it is: A line chart of your brand's visibility score and mention count over time, with optional overlay lines for up to 3 competitors.
How it works: Plots your score and mentions per run, and lets you toggle competitors on/off from a dropdown to see how your trend compares to theirs run over run.
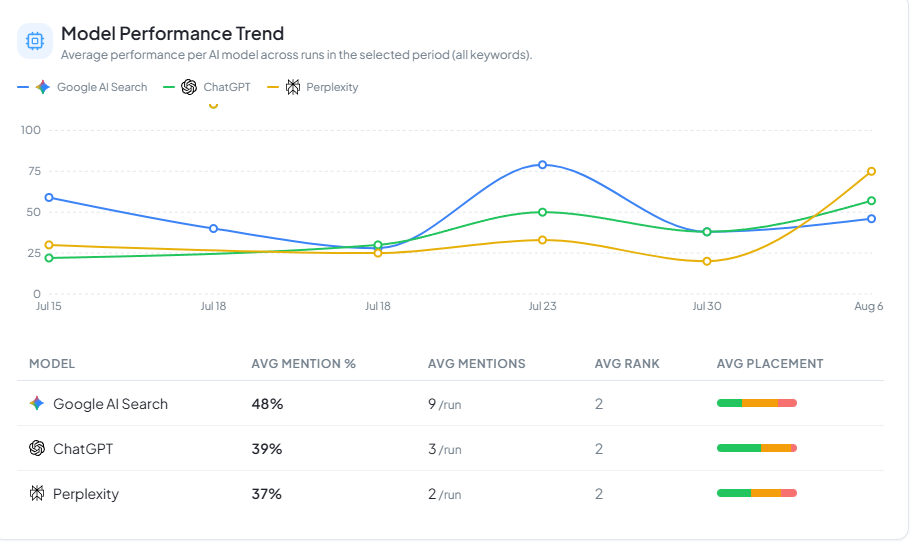
Model Performance Trend
What it is: A breakdown of how your visibility score trends separately on each AI model you track.
How it works: Plots a separate trend line per model (ChatGPT, Google AI Mode, Google AI Overview, Perplexity, etc.) and summarizes each model's placement quality as a top/mid/low tier bar, so you can see which model is improving and which is falling behind.
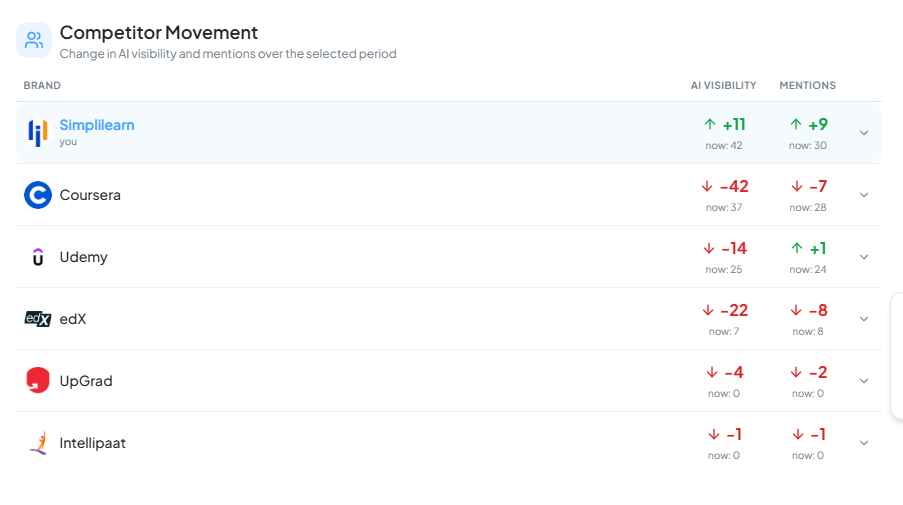
Competitor Movement
What it is: A run-over-run view of how you and your competitors are gaining or losing ground.
How it works: Shows each competitor's score change since the last run (up/down/no change) alongside their current value, so movement — not just the current snapshot — is the first thing you see.
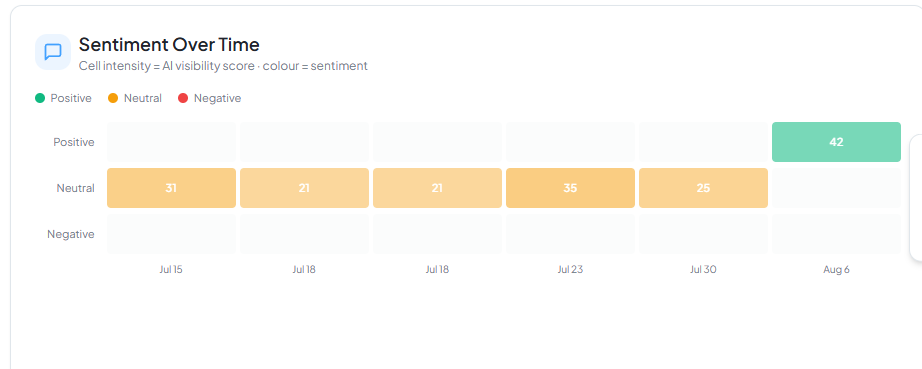
Sentiment History
What it is: A heatmap of how AI sentiment toward your brand (Positive/Neutral/Negative) has shifted run over run.
How it works: Colors each run's cell by the dominant sentiment level, with intensity scaled to that run's visibility score, so you can spot both sentiment shifts and their strength at a glance.
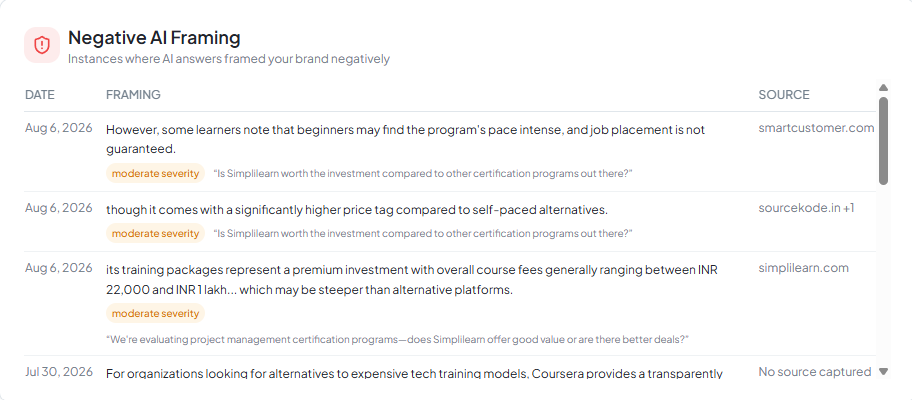
Negative AI Framing Over Time
What it is: A running log of every instance where AI answers described your brand negatively, across the runs in your selected window.
How it works: Lists each occurrence with its date, the framing phrase, severity (high/moderate), and source, and collapses repeated occurrences of the same phrase so you can expand to see every instance if needed.
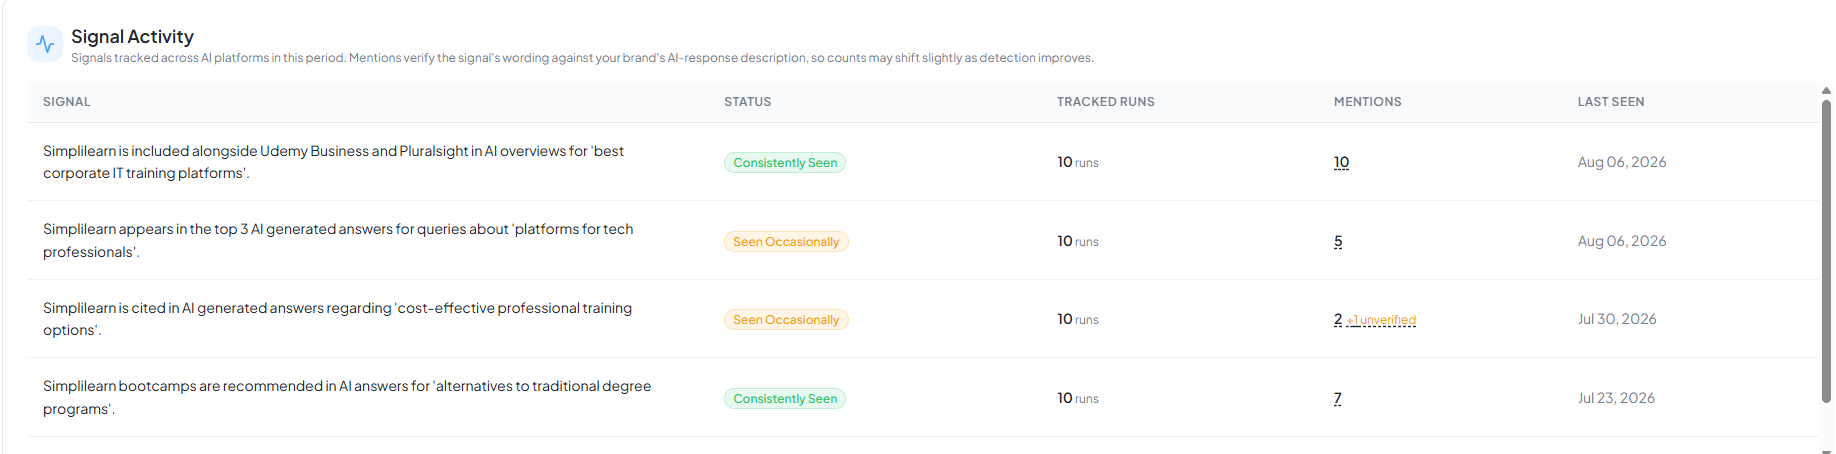
Signal Activity Log
What it is: A history of your tracked recommendation signals and whether they're being seen across recent runs.
How it works: Lists each tracked signal with its status (Consistently Seen, Seen Recently, Seen Occasionally, Not Seen Yet), tracked runs, mention count, and last-seen date, filtered to your selected trend window.
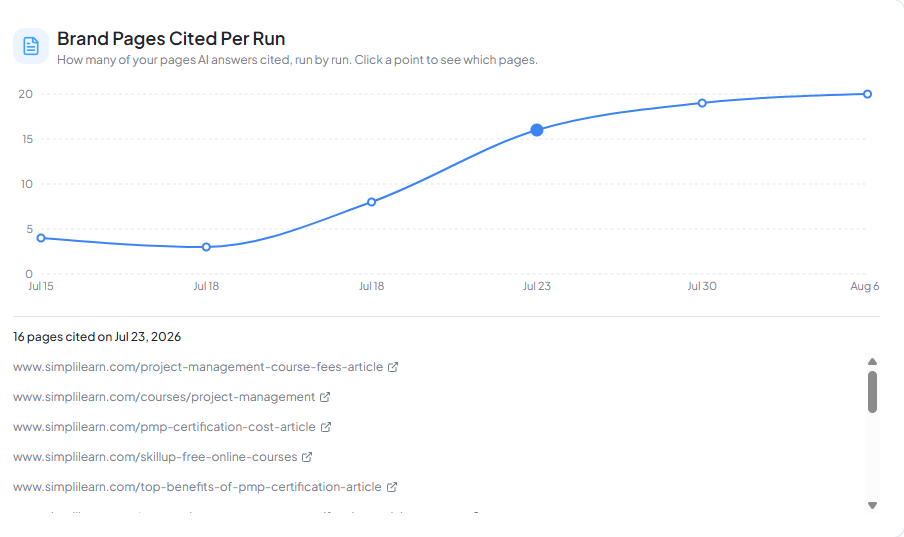
Your Pages Trend
What it is: A run-by-run view of how many of your own pages are being cited in AI responses.
How it works: Plots cited-page count per run as a clickable line chart — click any point to see exactly which of your pages were cited in that run.
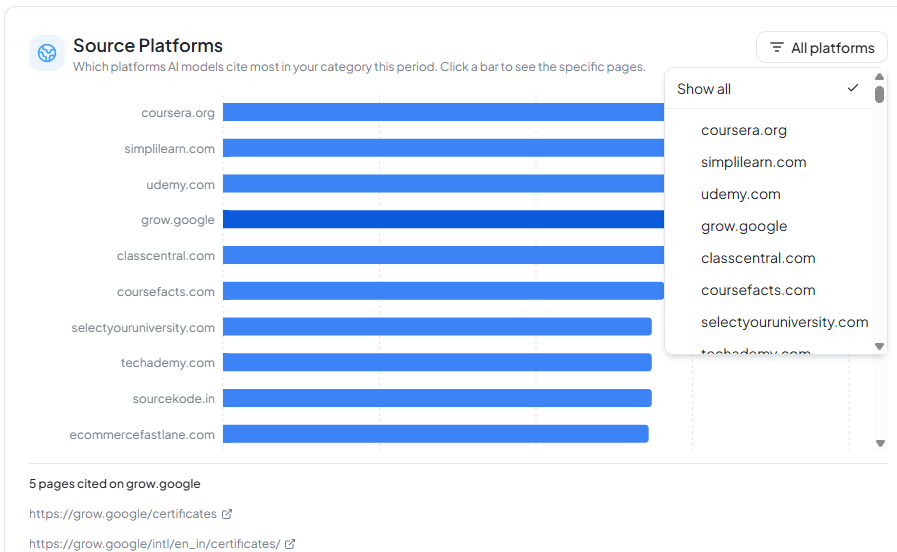
Source Platforms
What it is: A breakdown of which domains/platforms AI responses cite most often as sources.
How it works: Bar chart of total citations per platform across your selected window; click a bar to see the specific pages cited from that platform.
How to use it: Open the Trends tab from the main navigation, alongside Overview, Performance Insights, and Action Center. Use the 15/30/45/60-day selector at the top to change the window.
Added Perplexity Model Tracking
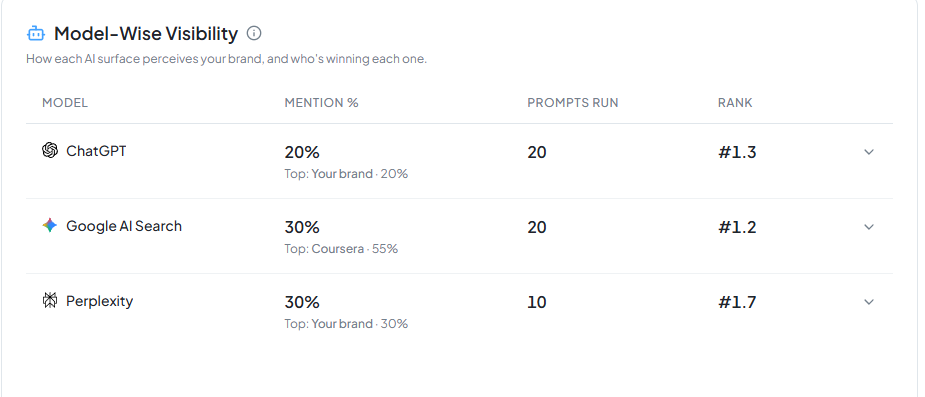
What it is: Perplexity is now tracked as one of the AI platforms in your visibility analysis, alongside ChatGPT and Google AI.
How it works: Your prompts are run against Perplexity on the same schedule as your other tracked models, and its results feed into your mention rate, rank, and Model-Wise Visibility breakdown just like the rest.
How to use it: No setup needed — Perplexity results appear automatically anywhere model-level data is shown (Overview, Prompts, Model-Wise Visibility).
Consolidation of Google AI Mode and AI Overview to Google AI Search
What it is: Google AI Mode and Google AI Overview are now tracked together under a single "Google AI Search" platform.
How it works: Following Google's own consolidation at Google I/O (Gemini 3.5 Flash becoming the default model powering AI Mode in Google Search worldwide), we're aligning our tracking to match — reflecting how Google itself now unifies these surfaces.
How to use it: You'll see "Google AI Search" wherever you previously saw AI Mode / AI Overview as separate platforms — no action needed on your end.
On-Demand Run Capability with Limits
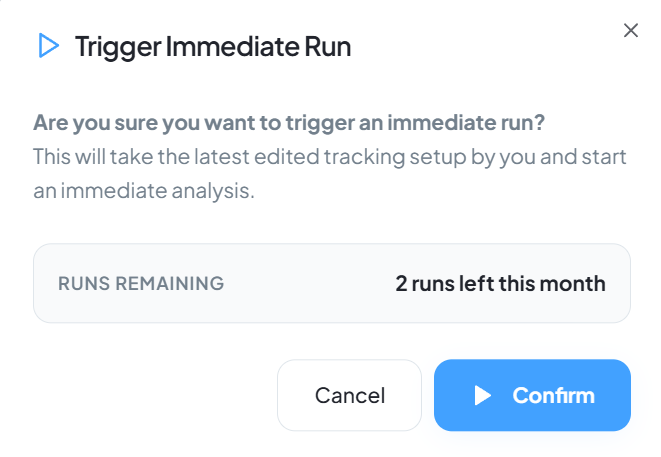
What it is: The ability to trigger a fresh analysis run whenever you need one, without waiting for the next scheduled run.
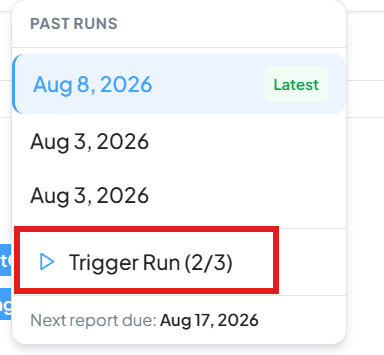
How it works: Each plan gets a monthly on-demand run allowance (Launch: 1/month, Grow/Enterprise/Agency: 3/month). Runs count against this cap, and the allowance resets on the 1st of each month.
How to use it: Click "Trigger Run" in the results header — it shows your remaining runs for the month (e.g. "Trigger Run (2/3)"). Once your limit is reached, you'll need to wait for the monthly reset.
Ready to explore these updates?
Dive into your dashboard to start using the latest features and improvements we added to GeoRankers.
Go to Dashboard